Weekly hi-res satellite imagery in CalTopo
A common question for backcountry users: How much snow is on the ground, right now, at a given location?
Is the trailhead snowed in?
Is my intended campsite under snow, or is there some exposed ground?
Are there some snow patches available for drinking water on the ridge climb I want to try?
Can I still get a few more runs in, or is backcountry ski season really over?
Is the brush filled valley you need to cross still covered with snow, making it much easier?
How does the snow level at a certain location compare from year to year at the same time?
Yes, you can look at snow depth models, as we cover in this article, but often seeing the snow level directly is really helpful, especially when you can overlay track and waypoints of your intended route over the top.
Well, as usual, CalTopo has you covered.
For subscribers at the “Pro” level ($50 a year) CalTopo, the best backcountry mapping software, now offers weekly, high resolution satellite imagery. This can be a very useful tool for trip planning, because you can see current snow levels in the satellite imagery overlaid on a base map, along with a GPX track and waypoints.
Bonus, you can print this, which you can’t easily do with the Google satellite imagery in CalTopo.
Summer 2021 update: imagery now is available six or more times a month rather than weekly, so sometimes you get imagery on a five day cycle, even better!
Other options . . .
Before we take a closer look at CalTopo, note that there are some other ways to view recent satellite imagery.
Gaia GPS has a map layer they call “FreshSat”. This is available for a premium level subscription of around $40 a year. This works pretty well, but the resolution does not seem to be as good as the CalTopo layer, and you can only see the most recent imagery, instead of the historical imagery that CalTopo offers. But, if you already have a Gaia Premium subscription, give that a try and see how it works for you.
You can also look at the Sentinel satellite imagery, which is basically free, but the user interface has a bit of a learning curve. If you want to explore this tool, use the link above.
What about Google? Google does offer wonderful high resolution satellite images, but as of summer 2021, it's definitely not on a weekly basis. Depending on where you’re looking, updates can be many months apart. So, if you're looking for current snow coverage, Google is probably not going to work.
Let’s look at a few examples in CalTopo, here of Mt. Adams Washington.
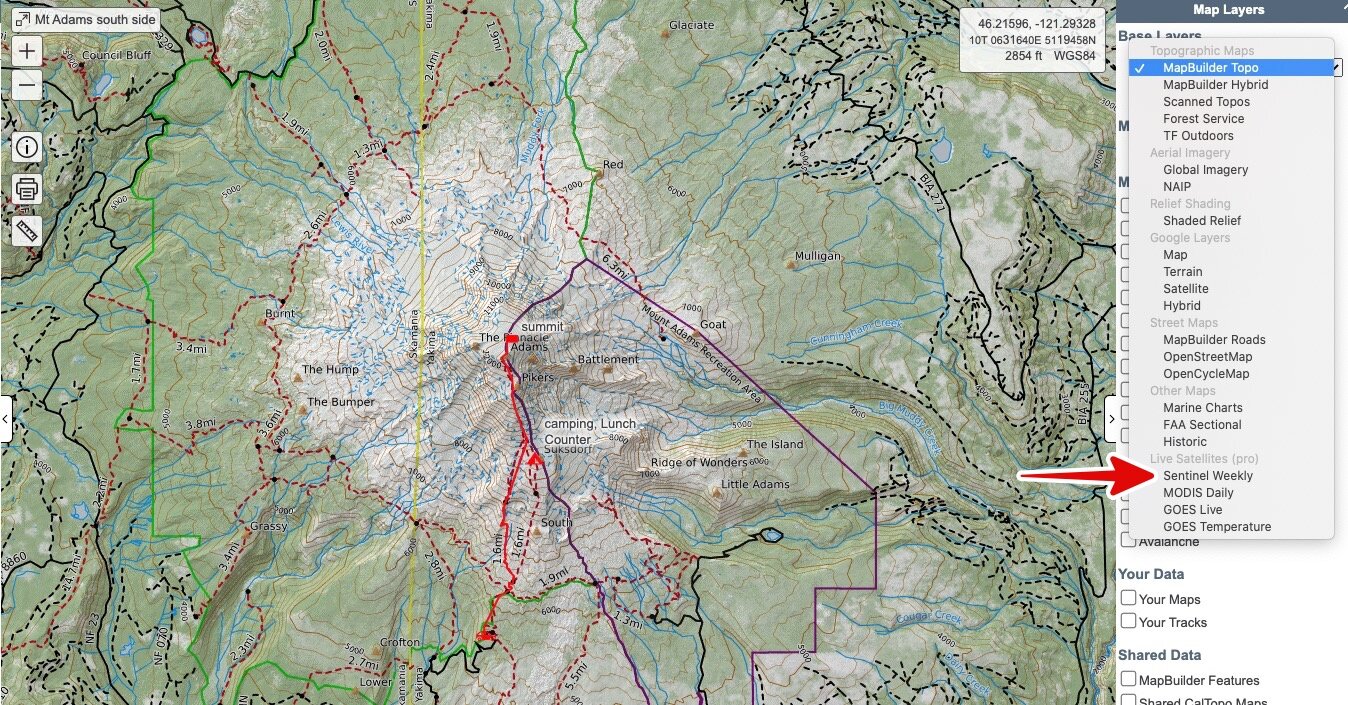
Here’s the default “MapBuilder Topo” layer in CalTopo, along with the GPX track of the climbing route, shown in red, with waypoints added for the trailhead, camp and summit.
(Tip: it's helpful to have a track like this and a few waypoints, because if you change the opacity of the underlying map, the opacity of your tracks and waypoints stays nicely visible. More on that below.)
From the Map Layers menu in the top right, you can choose “Sentinel Weekly”. (If you don’t have the Pro level subscription, these options are grayed out.)
From the “Sentinel Weekly” drop-down menu, you can look at historical imagery back to 2017.
A great feature of CalTopo: stacking one map layer on top of another and then changing the opacity. Here’s the MapBuilder Topo layer stacked on top of the satellite imagery, with the topo layer set to 33% opacity. This lets you see both the snow line and the underlying roads, trails, contours, etc.
Notice that the red GPX track showing the route and the waypoints remain at full brightness and easy to see, regardless of what level you set the opacity.
Yes, this weekly satellite imagery does cost $50 a year. Is it worth it? If you spend a lot of time in the backcountry, and want the most recent imagery to help plan your trip, probably yes.
Fortunately, there are other CalTopo subscription options. While it doesn't offer weekly imagery, many people find the $20 subscription to be a good balance of features and cost. Even the free version of CalTopo gives you a lot, but I encourage you to subscribe at some level to support the small team who makes this wonderful tool available. Software developers have to eat too!
Here's a sequence of (pretty much) monthly images of Mt. Adams in spring-summer 2020. Getting cloud-free images in the Pacific Northwest can be difficult, so the images are not all 30 days apart, but you get the general idea. Again, notice the approximate 30% opacity of the underlying map, which shows trails and roads and contours.
Finally, here's a sequence from Mt. Shasta in Northern California in July, 2017-2021. This helps answers the question of what's the snow level like this year compared to previous years? Short answer, 2021 is dry!
And hey, if you're stuck with me for this long, here's a little YouTube composite of the Mt. Adams imagery. Enjoy!


